Fig. 18
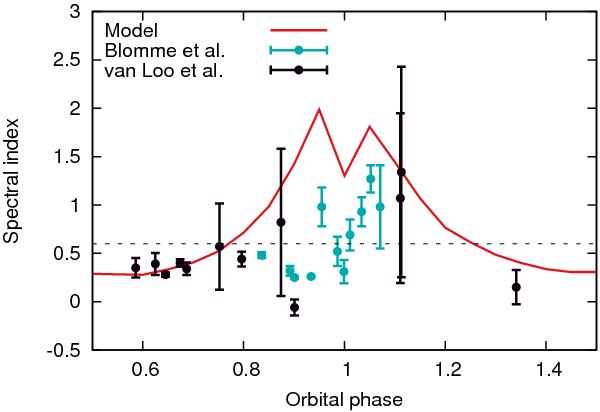
Spectral index between 1.6 and 5 GHz as a function of orbital phase. The calculation was performed using ζrel = 0.15, ζB = 5 × 10⁻⁵, p = 1.6, i = 60°, and θ = 280°. Observationally inferred spectral index values from van Loo et al. (2008) and Blomme et al. (2013) are shown for comparison − error bars have been computed by error propagation. The dashed horizontal line at spectral index of 0.6 corresponds to the canonical value for free-free emission from a single massive star wind.
Current usage metrics show cumulative count of Article Views (full-text article views including HTML views, PDF and ePub downloads, according to the available data) and Abstracts Views on Vision4Press platform.
Data correspond to usage on the plateform after 2015. The current usage metrics is available 48-96 hours after online publication and is updated daily on week days.
Initial download of the metrics may take a while.