Fig. 2
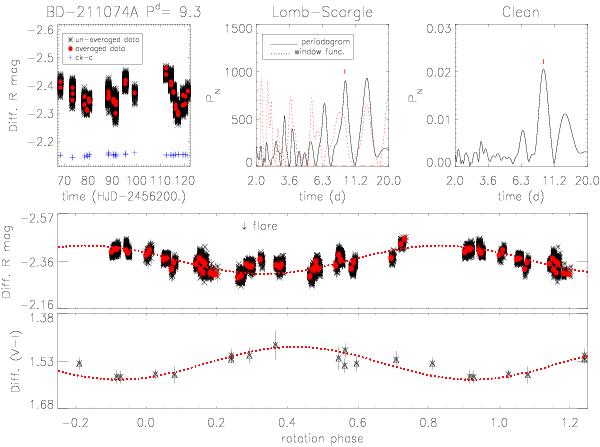
Results of the rotation period search for BD−21 1074A. Top panels: differential magnitude time series of BD−21 1074A and of CK−C (arbitrarily shifted in magnitude), where asterisks and bullets represent the un-averaged and averaged (2 h bin) data, respectively; L-S and Clean periodograms showing the power peak corresponding to the rotation period. Middle panel: phased light curve with the rotation period with the sinusoidal fit. Bottom panel: differential (V − I) color curve and the sinusoidal fit.
Current usage metrics show cumulative count of Article Views (full-text article views including HTML views, PDF and ePub downloads, according to the available data) and Abstracts Views on Vision4Press platform.
Data correspond to usage on the plateform after 2015. The current usage metrics is available 48-96 hours after online publication and is updated daily on week days.
Initial download of the metrics may take a while.