Fig. 8
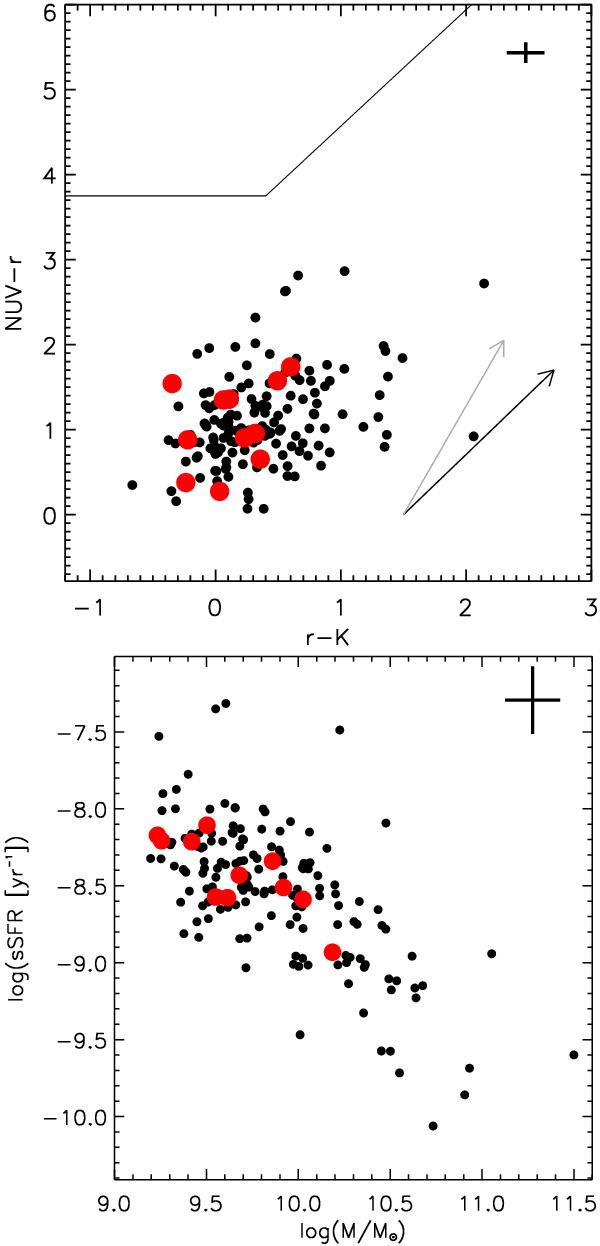
Top: NUV − r vs. r − K rest frame colours. Black dots are the control sample, red filled circles are the galaxies in the structure. The solid thick lines comprise the locus of passive galaxies defined in Arnouts et al. (2013). The two arrows represent the attenuation vectors for starburst (dark arrow) and Small Magellanic Cloud (light arrow) attenuation curves assuming E(B − V) = 0.4 as in Arnouts et al. (2013, see their Fig. 2). Bottom: sSFR versus stellar mass. Symbols as in the top panel. In both panels, the cross in the top right corner shows the typical error on the quantities plotted on the two axes. The possible systematic offset in the SFR computation due to the choice of different SFHs (see Sect. 2.1) is not included when deriving the error on the sSFR.
Current usage metrics show cumulative count of Article Views (full-text article views including HTML views, PDF and ePub downloads, according to the available data) and Abstracts Views on Vision4Press platform.
Data correspond to usage on the plateform after 2015. The current usage metrics is available 48-96 hours after online publication and is updated daily on week days.
Initial download of the metrics may take a while.