Fig. 7
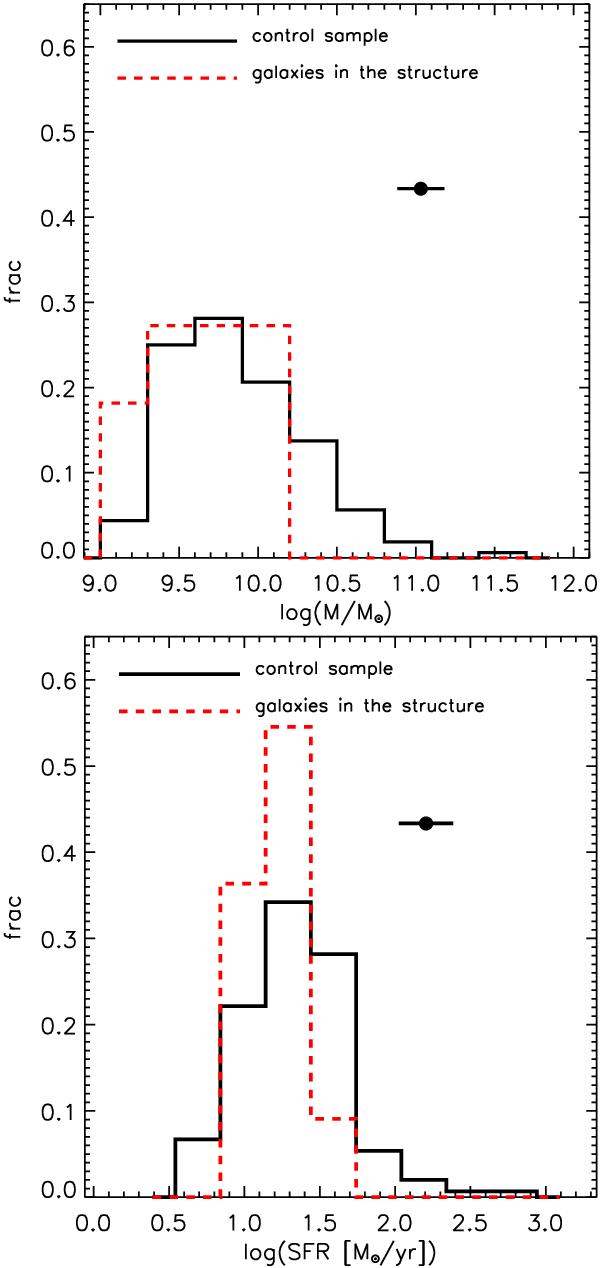
Top: distribution of galaxy stellar masses in the control sample (black solid line) and in the structure (red dashed line). Bottom: same as in the top panel, but for the distribution of SFR. In both panels, the solid point with the error bar shows the typical error on ℳ and SFR. The possible systematic offset in the SFR computation due to the choice of different SFHs (see Sect. 2.1) is not included.
Current usage metrics show cumulative count of Article Views (full-text article views including HTML views, PDF and ePub downloads, according to the available data) and Abstracts Views on Vision4Press platform.
Data correspond to usage on the plateform after 2015. The current usage metrics is available 48-96 hours after online publication and is updated daily on week days.
Initial download of the metrics may take a while.