Fig. 4
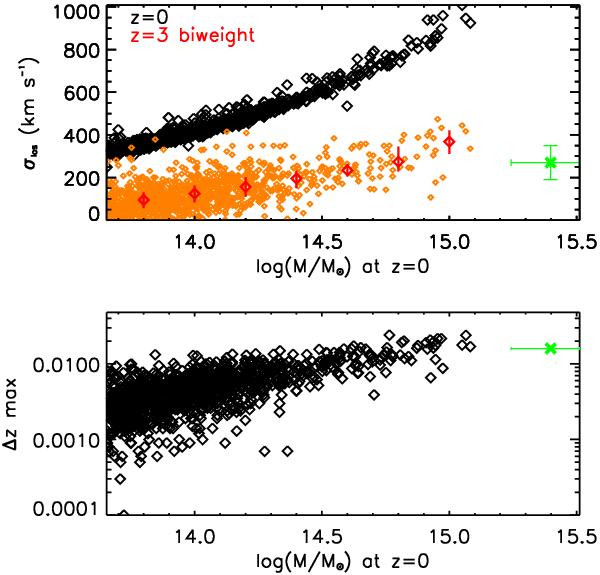
Top: as in Fig. 3, but on the y-axis we show the velocity dispersion along the line of sight (σlos). Black points are σlos at z = 0 as stored in the Millennium Database; orange points are σlos computed using the redshift of the galaxies at z ~ 2.9 with the biweight method (see text for details); red symbols represent the median values of the orange points, in bin of 0.2 in log (M/M⊙), and their bars show the 25% and 75% of the distribution. The green cross represents the velocity dispersion of our overdensity, as computed at the beginning of Sect. 3. Bottom: the same as in the top panel, but on the y-axis there is the maximum separation in redshift at z ~ 2.9 of the galaxies in each proto-cluster. The green cross represents the Δzmax of our overdensity (see Sect. 3).
Current usage metrics show cumulative count of Article Views (full-text article views including HTML views, PDF and ePub downloads, according to the available data) and Abstracts Views on Vision4Press platform.
Data correspond to usage on the plateform after 2015. The current usage metrics is available 48-96 hours after online publication and is updated daily on week days.
Initial download of the metrics may take a while.