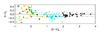
Fig. 3
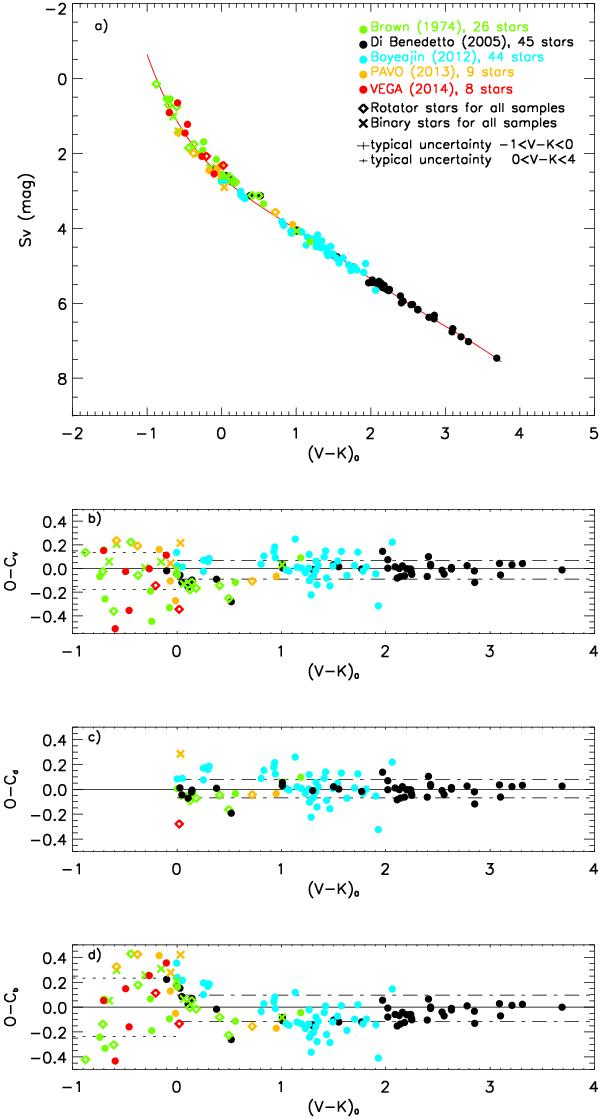
Relation between visual surface brightness SV as a function of the color index (V − K)0. The black, light blue, green, brown, and red measurements are from Di Benedetto (2005), Boyajian et al. (2012), Hanbury Brown et al. (1974a), Maestro et al. (2013), and VEGA (this work), respectively. The red line corresponds to our fit when considering all stars. The rms of the difference between the surface brightness computed from our fit and measured surface brightness is presented in the lower panels (see the text for more detail).
Current usage metrics show cumulative count of Article Views (full-text article views including HTML views, PDF and ePub downloads, according to the available data) and Abstracts Views on Vision4Press platform.
Data correspond to usage on the plateform after 2015. The current usage metrics is available 48-96 hours after online publication and is updated daily on week days.
Initial download of the metrics may take a while.