Table 3
Definition of the quality flags of the fit between the observed and the reconstructed synthetic spectra (see Table 3).
| Teff domain [K] | Flags | % spectra | χ2 limits |
|
|
|||
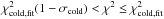
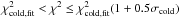
| 4000 ≤ Teff ≤ 5000 | 0 | 10 |

|
| 1 | 59 |
|
|
| 2 | 31 |
|
|
|
|
|||
| 5000 <Teff ≤ 6500 | 0 | 44 |

|
| 1 | 51 |

|
|
| 2 | 4 |

|
|
|
|
|||
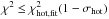
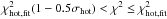
| Teff> 6500 | 0 | 26 |
|
| 1 | 14 |

|
|
| 2 | 60 |
|
|
Notes. In the second column, the flags are defined as: 0 = Very Good, 1 = Good, and 2 = Acceptable. The third column refers to the percentage of spectra associated with the corresponding χ2 flag. The last column defines the selection criteria for the flags.  and σcold;
  and σwarm; and
  and σhot refer to 11%, 83%, and 2% of the delivered spectra, respectively. The percentages of the different temperature domains does not sum to 100% because we have excluded spectra with Teff< 4000 K.
Current usage metrics show cumulative count of Article Views (full-text article views including HTML views, PDF and ePub downloads, according to the available data) and Abstracts Views on Vision4Press platform.
Data correspond to usage on the plateform after 2015. The current usage metrics is available 48-96 hours after online publication and is updated daily on week days.
Initial download of the metrics may take a while.