Fig. 9
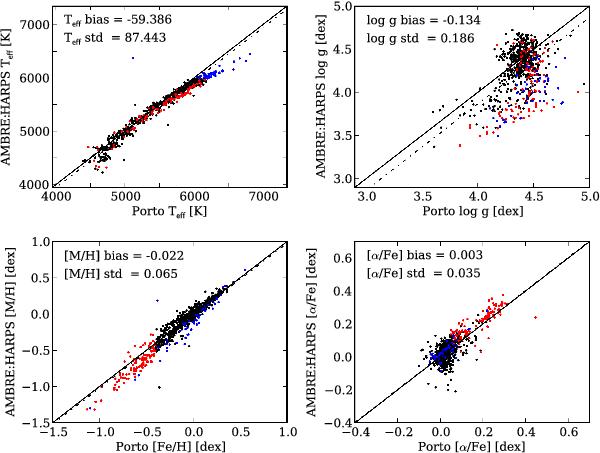
Comparison between the stellar atmospheric parameters derived by the AMBRE:HARPS pipeline and the reference sample from Porto. The solid line in each panel traces the one-to-one relation, while the dot-dashed line shows the location of the bias between the samples. Stars with Teff> 6000 K are plotted in the panels with blue dots; stars with [Fe/H] < − 0.4 dex are the red dots. The biases in Teff, log g, [M/H] and [α/Fe] for stars marked with red dots are −90.1 K, −0.349 dex, −0.098 dex, and 0.030 dex, respectively. For stars marked with blue dots the biases are −161.3 K, −0.451 dex, −0.093 dex, and 0.011 dex, respectively.
Current usage metrics show cumulative count of Article Views (full-text article views including HTML views, PDF and ePub downloads, according to the available data) and Abstracts Views on Vision4Press platform.
Data correspond to usage on the plateform after 2015. The current usage metrics is available 48-96 hours after online publication and is updated daily on week days.
Initial download of the metrics may take a while.