Fig. 3
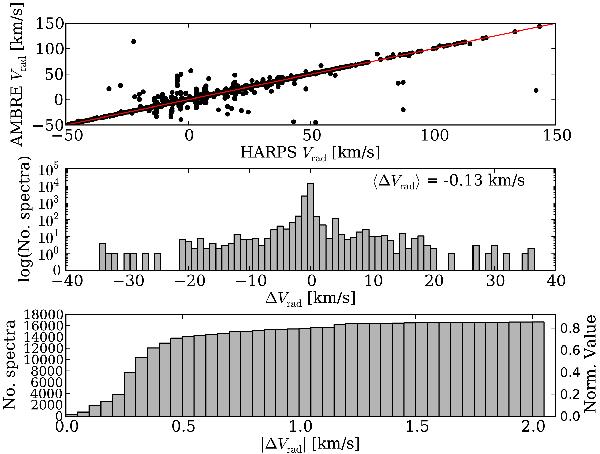
Top panel: comparison between the radial velocity as calculated from the AMBRE radial velocity program and from the HARPS pipeline for the 2004 sample (~17 000 spectra). The distribution is Gaussian. Middle panel: distribution of ΔVrad between HARPS and AMBRE radial velocities using a logarithmic scale. Bottom panel: cumulative distribution of the | ΔVrad | in bins of 0.05 km s-1. Almost 70% of the spectra have a | ΔVrad | smaller than 0.6 km s-1. Moreover, almost 90% of the spectra are found between ΔVrad = ±1 km s-1.
Current usage metrics show cumulative count of Article Views (full-text article views including HTML views, PDF and ePub downloads, according to the available data) and Abstracts Views on Vision4Press platform.
Data correspond to usage on the plateform after 2015. The current usage metrics is available 48-96 hours after online publication and is updated daily on week days.
Initial download of the metrics may take a while.