Fig. 11
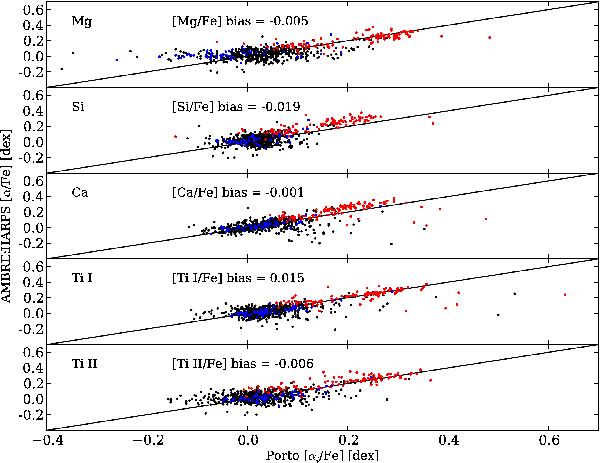
Comparison between the mean α-abundances derived by the AMBRE pipeline and the abundances of the individual α-elements determined by Porto. The largest departures from the 1-to-1 line are found for the Si and Ca abundances and could explain the departure observed in Fig. 9 for the most metal-poor stars. As in Fig. 10, stars with Teff> 6000 K are plotted in the panels with blue dots; stars with [Fe / H ]< − 0.4 dex are the red dots.
Current usage metrics show cumulative count of Article Views (full-text article views including HTML views, PDF and ePub downloads, according to the available data) and Abstracts Views on Vision4Press platform.
Data correspond to usage on the plateform after 2015. The current usage metrics is available 48-96 hours after online publication and is updated daily on week days.
Initial download of the metrics may take a while.