Fig. 4
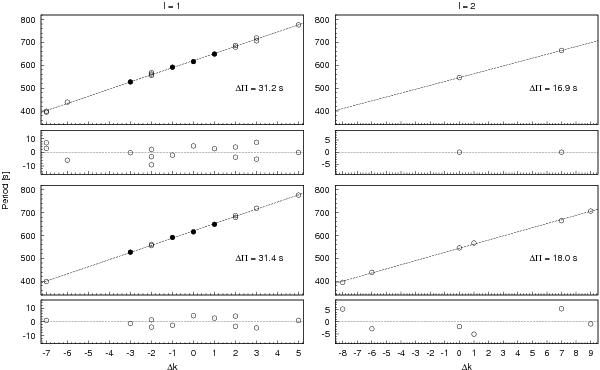
Periods of Table 4 plotted in the Δk – period planes. Filled circles denote average periods by the 9 μHz spacings. The panels on the left and right show the ℓ = 1 and 2 solutions and their linear least-squares fits, respectively. The residuals of the fits are also presented. Top and bottom rows display different solutions by changing some periods’ presumed ℓ values. The resulting period spacings (ΔΠℓ = 1,2) are denoted.
Current usage metrics show cumulative count of Article Views (full-text article views including HTML views, PDF and ePub downloads, according to the available data) and Abstracts Views on Vision4Press platform.
Data correspond to usage on the plateform after 2015. The current usage metrics is available 48-96 hours after online publication and is updated daily on week days.
Initial download of the metrics may take a while.