Free Access
Fig. 2
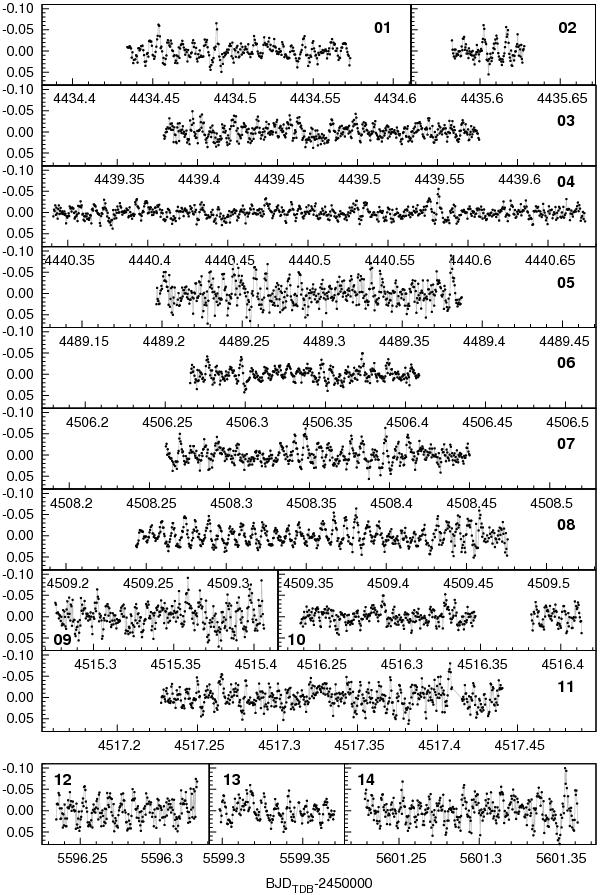
Normalized differential light curves of the Konkoly runs. Data were collected in the 2007/2008 observing season (upper panels) and in 2011 (lower panels). For better visibility of the pulsation cycles, we connected the points with grey lines. Boldface numbers in the corners correspond to the run numbers in Table 1.
Current usage metrics show cumulative count of Article Views (full-text article views including HTML views, PDF and ePub downloads, according to the available data) and Abstracts Views on Vision4Press platform.
Data correspond to usage on the plateform after 2015. The current usage metrics is available 48-96 hours after online publication and is updated daily on week days.
Initial download of the metrics may take a while.