Fig. 3
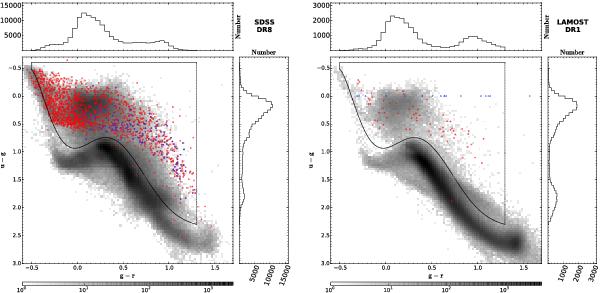
SDSS (left) and LAMOST (right) density maps in the u − g vs. g − r plane. Identified DA/M binaries are shown as red open circles (blue open circles represent SEGUE and GAC DA/M binaries in the left and right panels, respectively). The solid black lines are colour-cuts defined for selecting DA/M binaries and excluding single main sequence stars. The number distribution of objects as a function of u − g and g − r within these cuts are provided in the upper and right panels, respectively.
Current usage metrics show cumulative count of Article Views (full-text article views including HTML views, PDF and ePub downloads, according to the available data) and Abstracts Views on Vision4Press platform.
Data correspond to usage on the plateform after 2015. The current usage metrics is available 48-96 hours after online publication and is updated daily on week days.
Initial download of the metrics may take a while.