Free Access
Fig. 6
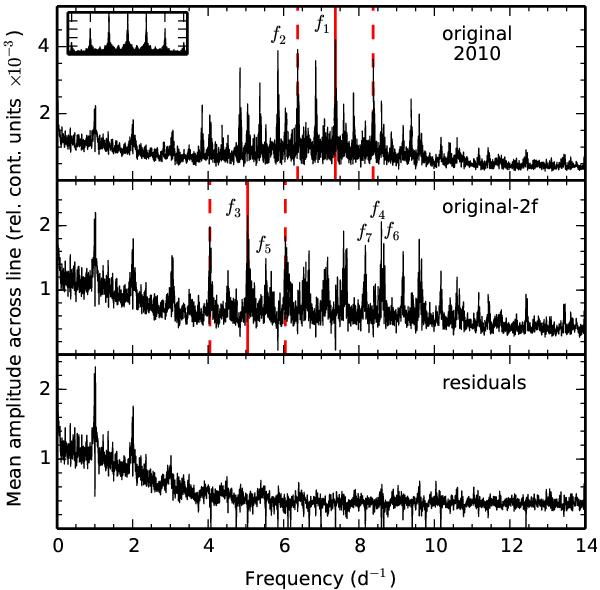
Same as Fig. 5 for the season of 2010. From top to bottom: mean Fourier spectra of the original data set, and after prewhitening of 2 and 17 frequencies, respectively. The highest peaks marked by the red solid lines are f1 = 7.3764 d-1 (upper panel) and f3 = 5.0481 d-1 (center panel).
Current usage metrics show cumulative count of Article Views (full-text article views including HTML views, PDF and ePub downloads, according to the available data) and Abstracts Views on Vision4Press platform.
Data correspond to usage on the plateform after 2015. The current usage metrics is available 48-96 hours after online publication and is updated daily on week days.
Initial download of the metrics may take a while.