Fig. 5
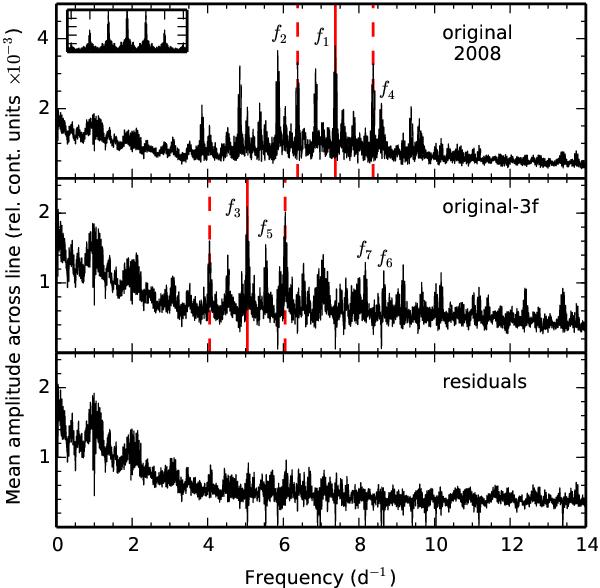
Mean of the Lomb-Scargle periodograms per bin of the season of 2008. From top to bottom: mean Fourier spectra of the original data set, and after prewhitening of 3 and 14 frequencies, respectively. The red solid lines mark the highest peak in each periodogram, while the red dashed lines mark the respective one-day aliases. Highest peaks are f1 = 7.3764 d-1 (upper panel) and f3 = 5.0481 d-1 (center panel). The inset in the upper panel displays the spectral window for the 2008 data set.
Current usage metrics show cumulative count of Article Views (full-text article views including HTML views, PDF and ePub downloads, according to the available data) and Abstracts Views on Vision4Press platform.
Data correspond to usage on the plateform after 2015. The current usage metrics is available 48-96 hours after online publication and is updated daily on week days.
Initial download of the metrics may take a while.