Free Access
Fig. 11
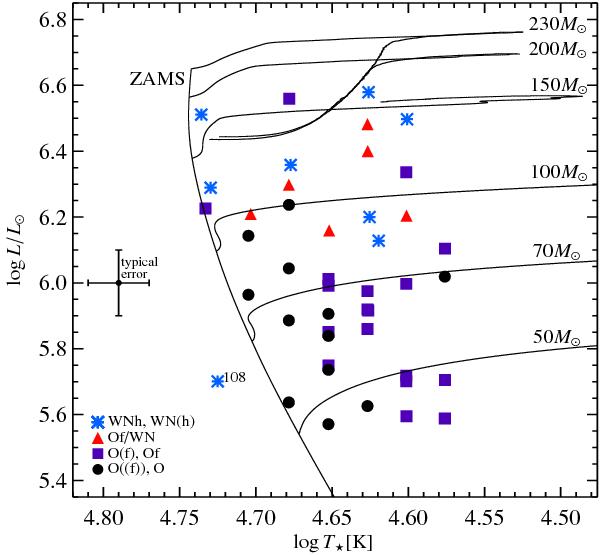
Distribution of spectral types of our sample in the HR-diagram. The different symbols indicate stellar sub-classes following Sect. 4.1. Black lines indicate evolutionary tracks from Köhler et al. (2014) for an initial rotation rate of 300 km s-1 and the location of the Zero-Age Main Sequence (ZAMS).
Current usage metrics show cumulative count of Article Views (full-text article views including HTML views, PDF and ePub downloads, according to the available data) and Abstracts Views on Vision4Press platform.
Data correspond to usage on the plateform after 2015. The current usage metrics is available 48-96 hours after online publication and is updated daily on week days.
Initial download of the metrics may take a while.