Fig. 4
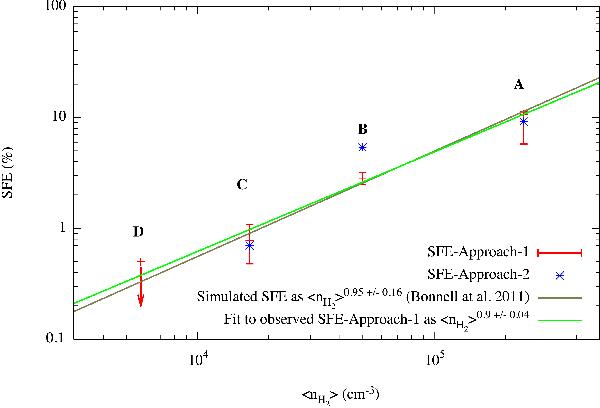
Linear dependence of the star formation efficiency in subregions A–D on cloud volume density. The red points and error bars correspond to the first approach explained in Sect. 5 to derive the SFEs and blue points to the second. The green line is the linear fit to the first approach and the brown line the relation of Bonnell et al. (2011).
Current usage metrics show cumulative count of Article Views (full-text article views including HTML views, PDF and ePub downloads, according to the available data) and Abstracts Views on Vision4Press platform.
Data correspond to usage on the plateform after 2015. The current usage metrics is available 48-96 hours after online publication and is updated daily on week days.
Initial download of the metrics may take a while.