Fig. 1
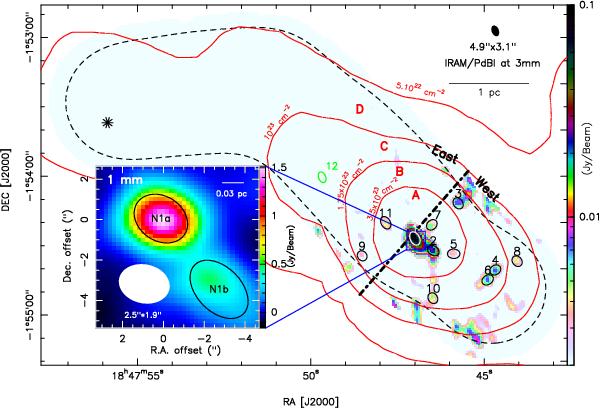
IRAM/PdBI 3 mm continuum image of the W43-MM1 ridge, revealing a cluster of MDCs. The black dashed contour outlines the area where the confidence-weight map exceeds 90%. Column densities yielded by Herschel imaging (see Nguyen Luong et al. 2013) and shown in red contours are used to define A–D subregions. The black dotted-dashed line and the 1023 cm-2 contour outline the eastern and western parts of the ridge. Black and white ellipses plus numbers locate MDCs extracted by Getsources (see Table 2), the green ellipse outlines N12, and the black asterisk pinpoints a source identified by Beuther et al. (2012). Negative contours have been removed to reduce confusion. See Fig. 6 for the version with negative contours. Zoom inset: IRAM/PdBI 1 mm continuum image of the W43-N1 MDC. Black ellipses are HMPCs extracted by Getsources (see Table 2).
Current usage metrics show cumulative count of Article Views (full-text article views including HTML views, PDF and ePub downloads, according to the available data) and Abstracts Views on Vision4Press platform.
Data correspond to usage on the plateform after 2015. The current usage metrics is available 48-96 hours after online publication and is updated daily on week days.
Initial download of the metrics may take a while.