Fig. 1
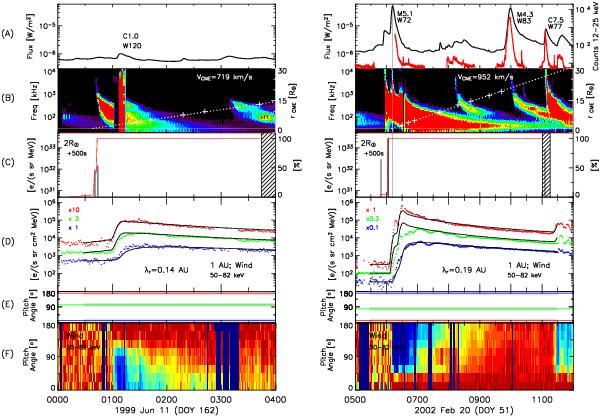
From top to bottom and for each event: (A) soft X-ray flux observed by GOES and hard X-ray emission detected by RHESSI (red curve; right axis) when available. (B) Radio flux observed by Wind/WAVES (the white horizontal line marks 30 kHz) and time-height plot of the CME leading edge (dotted curve; right axis). (C) Electron source profile deduced at 2 R⊙ (gray histogram) and total percentage of electrons (red curve; right axis). The profile has been shifted by +500 s to allow the comparison with the EM emissions. (D) Directional NR electron intensities measured near 1 AU. (E) Mean pitch-angle and range (gray area) scanned by each sector. (F) PADs measured by Wind/3DP normalized to unity in each time interval.

Current usage metrics show cumulative count of Article Views (full-text article views including HTML views, PDF and ePub downloads, according to the available data) and Abstracts Views on Vision4Press platform.
Data correspond to usage on the plateform after 2015. The current usage metrics is available 48-96 hours after online publication and is updated daily on week days.
Initial download of the metrics may take a while.