Fig. 7
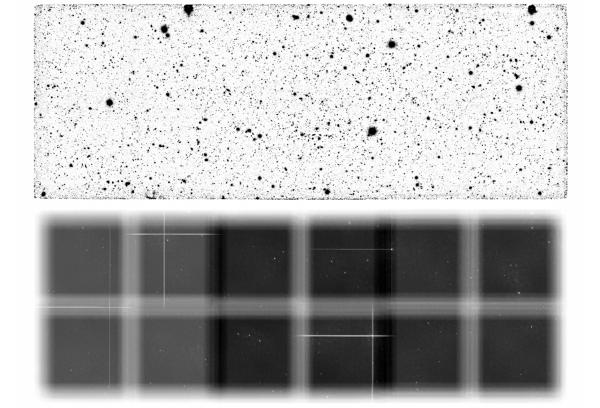
Top: final image of the UDS field in the Y band. Bottom: weight image, computed as described in the text. The bottom scale represents the rms, normalised to its peak value. Darker regions have lower rms, or equivalently higher relative weight, and hence correspond to deeper regions of the images. The left-most pointing (UDS3) is slightly shallower than the other two pointings, despite the fact they have the same exposure time, because the average background observed during the observations turned out to be larger than for the other two pointings.
Current usage metrics show cumulative count of Article Views (full-text article views including HTML views, PDF and ePub downloads, according to the available data) and Abstracts Views on Vision4Press platform.
Data correspond to usage on the plateform after 2015. The current usage metrics is available 48-96 hours after online publication and is updated daily on week days.
Initial download of the metrics may take a while.