Free Access
Fig. 3
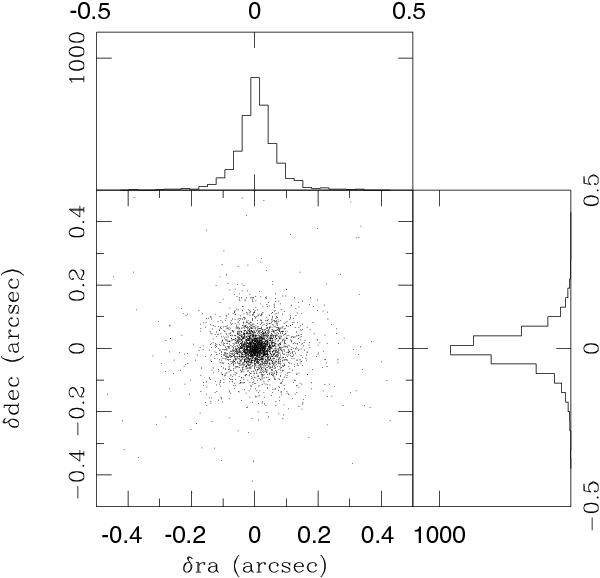
Differences in RA and Dec for all the objects detected in the overlapping region between the GD1 and GD2 pointings. The two insets on the right and top show the resulting distributions.
Current usage metrics show cumulative count of Article Views (full-text article views including HTML views, PDF and ePub downloads, according to the available data) and Abstracts Views on Vision4Press platform.
Data correspond to usage on the plateform after 2015. The current usage metrics is available 48-96 hours after online publication and is updated daily on week days.
Initial download of the metrics may take a while.