Fig. 2
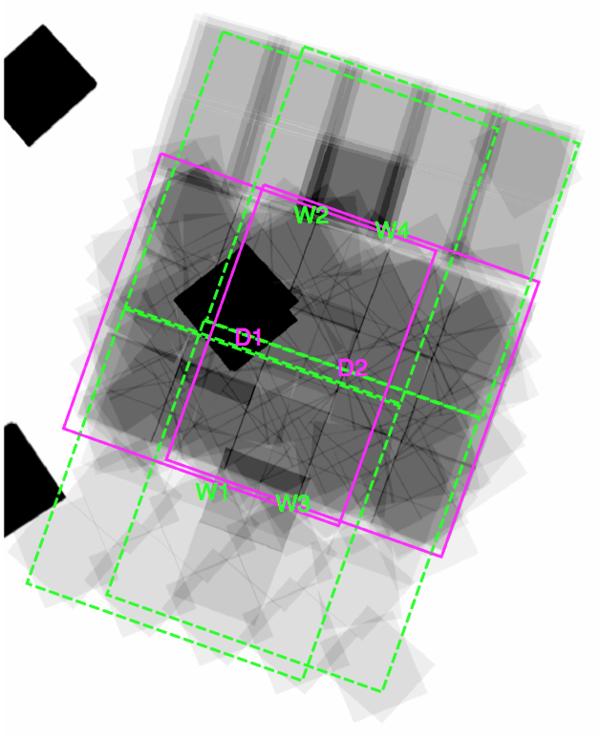
Location of the Hawk-I pointings overlaid on the exposure map of the WFC3 data available within the GOODS-South field. Magenta lines show the field-of-view of pointings D1 and D2, while the green lines show pointings W1, W2, W3 and W4 (see Table2). The black square at the centre is the HUDF12 region (Koekemoer et al. 2013). The greyscale of the WFC3/IR images is on a linear stretch that saturates at the deepest levels of the CANDELS data; the HUDF12 is deeply oversaturated.
Current usage metrics show cumulative count of Article Views (full-text article views including HTML views, PDF and ePub downloads, according to the available data) and Abstracts Views on Vision4Press platform.
Data correspond to usage on the plateform after 2015. The current usage metrics is available 48-96 hours after online publication and is updated daily on week days.
Initial download of the metrics may take a while.