Fig. 11
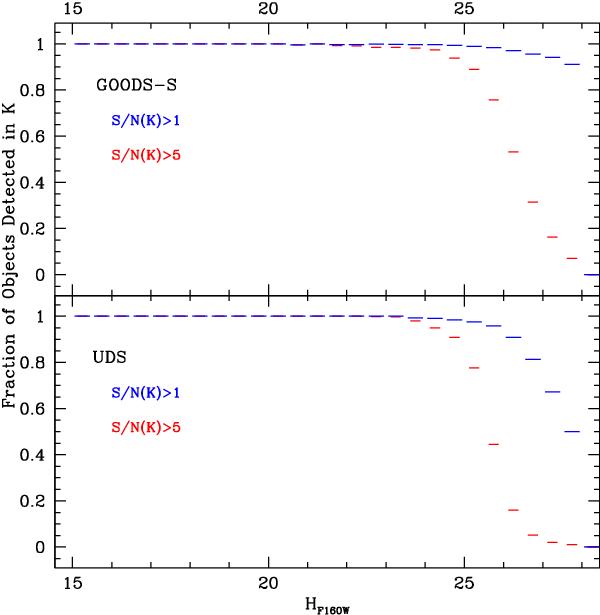
Fractions of objects in the CANDELS catalogues that have a detected flux in the HUGS data, as a function of the H-band magnitude. Here the H-band is measured on the CANDELS F160W images, and the corresponding K-band flux is measured with the TFIT code on the final HUGS images. Results are shown for two different signal-to-noise ratios in the K-band, and for the two HUGS fields (as shown in the legends). Errors are computed assuming simple Poisson statistics.
Current usage metrics show cumulative count of Article Views (full-text article views including HTML views, PDF and ePub downloads, according to the available data) and Abstracts Views on Vision4Press platform.
Data correspond to usage on the plateform after 2015. The current usage metrics is available 48-96 hours after online publication and is updated daily on week days.
Initial download of the metrics may take a while.