Fig. 10
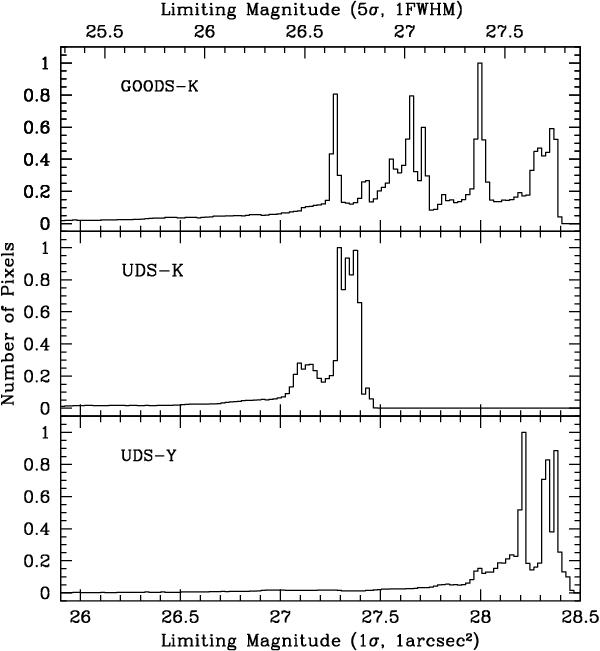
Distributions of limiting magnitude in the 3 HUGS images, as described in the legend. The lower x-axis shows the limiting magnitude computed at 1σ in an area of 1 arcsec2, the upper at 5σ in an area of 0.4 arcsec2, comparable to the average FWHM. Note that the latter is not the total magnitude of objects detected at 5σ in an area of 0.4 arcsec2, since no aperture correction has been applied.
Current usage metrics show cumulative count of Article Views (full-text article views including HTML views, PDF and ePub downloads, according to the available data) and Abstracts Views on Vision4Press platform.
Data correspond to usage on the plateform after 2015. The current usage metrics is available 48-96 hours after online publication and is updated daily on week days.
Initial download of the metrics may take a while.