Fig. 11
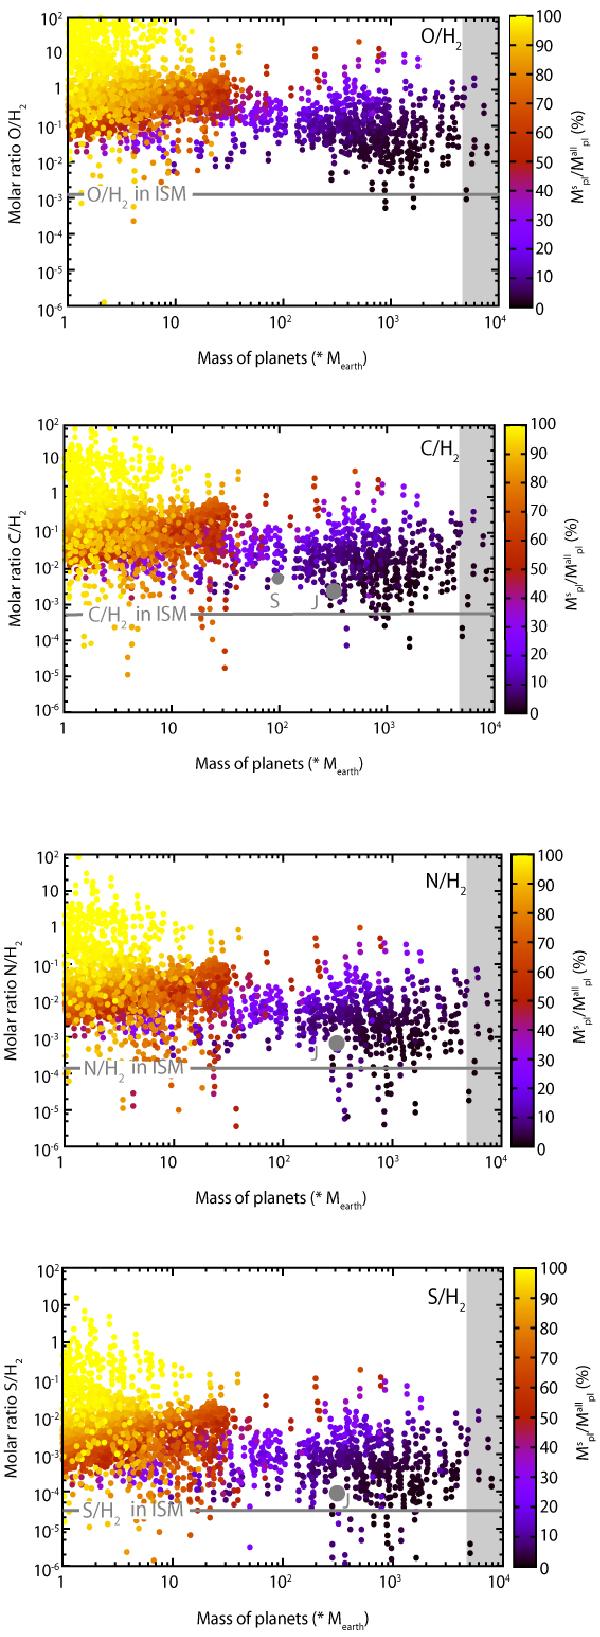
Molar ratio of atoms O, C, N, and S relative to the total mass of gas
H2 in
planets as a function of the total mass  of
planets and mass ratio of solids
of
planets and mass ratio of solids  relative to total planetary mass , for
all models. Horizontal gray lines represent abundances of atoms adopted in the
ISM. Gray dots J and S represent,
respectively, the abundances for Jupiter and Saturn. Data for Jupiter and Saturn
provided by Wong et al. (2004), Flasar et
al. (2005), Orton et al. (2005), and Briggs & Sackett (1989). The light
gray area on the right corresponds to the zone where the mass of planets is higher
than 13 Jovian masses and where there could be more brown dwarfs than giant
planets.
relative to total planetary mass , for
all models. Horizontal gray lines represent abundances of atoms adopted in the
ISM. Gray dots J and S represent,
respectively, the abundances for Jupiter and Saturn. Data for Jupiter and Saturn
provided by Wong et al. (2004), Flasar et
al. (2005), Orton et al. (2005), and Briggs & Sackett (1989). The light
gray area on the right corresponds to the zone where the mass of planets is higher
than 13 Jovian masses and where there could be more brown dwarfs than giant
planets.
Current usage metrics show cumulative count of Article Views (full-text article views including HTML views, PDF and ePub downloads, according to the available data) and Abstracts Views on Vision4Press platform.
Data correspond to usage on the plateform after 2015. The current usage metrics is available 48-96 hours after online publication and is updated daily on week days.
Initial download of the metrics may take a while.