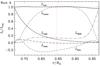
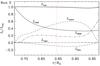
Fig. 2

Time-averaged energy fluxes from Runs A (top) and E (bottom): radiative (thin solid line), convective (dashed), kinetic energy (dash-dotted), SGS (triple-dash-dotted), and viscous (long-dashed) flux. The thick solid line denotes the total flux, whereas the red horizontal dotted lines show the zero and unity line. The red vertical dotted line at r = rm shows the midpoint of the convection zone.
Current usage metrics show cumulative count of Article Views (full-text article views including HTML views, PDF and ePub downloads, according to the available data) and Abstracts Views on Vision4Press platform.
Data correspond to usage on the plateform after 2015. The current usage metrics is available 48-96 hours after online publication and is updated daily on week days.
Initial download of the metrics may take a while.