Fig. 10
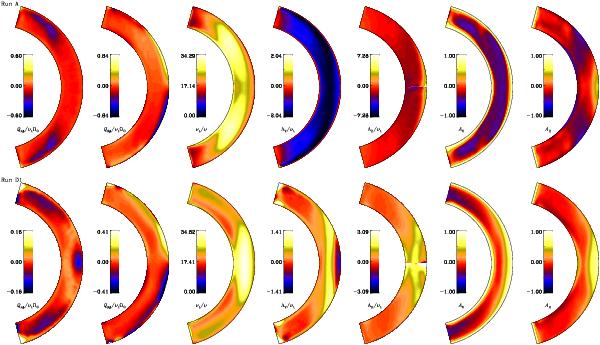
From left to right: time-averaged Reynolds stresses Qrφ and Qθφ normalized by νtΩ⊙, the turbulent viscosity divided by the molecular viscosity νt/ν, ΛV and ΛH normalized by νt, and the anisotropy parameters AV and AH. Top row: Run A; bottom row: Run D1. In the fifth column we only use data some degrees away from the equator so as to avoid the singularity associated with the division by cosθ. The contours in the lower row are oversaturated near the θ-boundaries in order to highlight the features at lower latitudes.

Current usage metrics show cumulative count of Article Views (full-text article views including HTML views, PDF and ePub downloads, according to the available data) and Abstracts Views on Vision4Press platform.
Data correspond to usage on the plateform after 2015. The current usage metrics is available 48-96 hours after online publication and is updated daily on week days.
Initial download of the metrics may take a while.