Free Access
Fig. 7
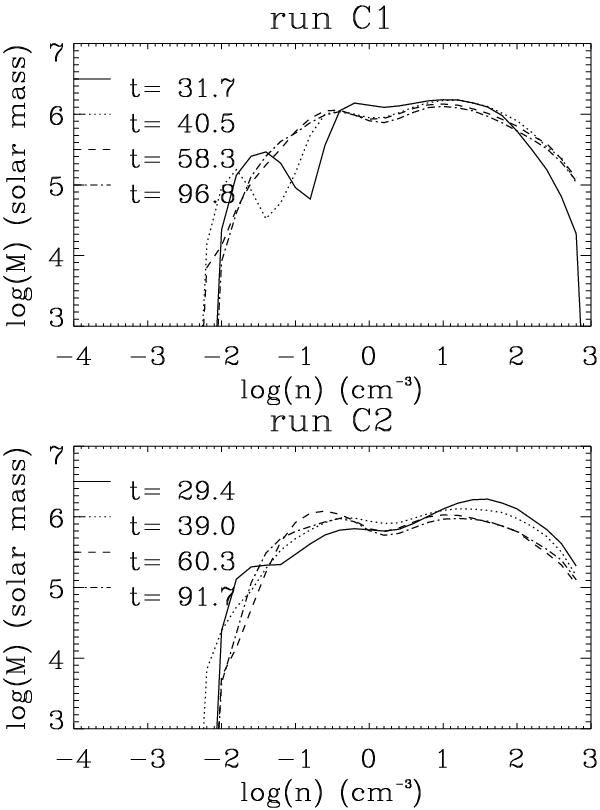
Probability density function for MHD run C1 (upper panel) and hydrodynamical run C2 (lower panel). The small drop at n ≃ 2 − 3 cm-3 corresponds to the thermally unstable regime, which persists in spite of the strong turbulence. The two peaks correspond to the WNM and CNM phases.
This figure is made of several images, please see below:
Current usage metrics show cumulative count of Article Views (full-text article views including HTML views, PDF and ePub downloads, according to the available data) and Abstracts Views on Vision4Press platform.
Data correspond to usage on the plateform after 2015. The current usage metrics is available 48-96 hours after online publication and is updated daily on week days.
Initial download of the metrics may take a while.