Fig. 9
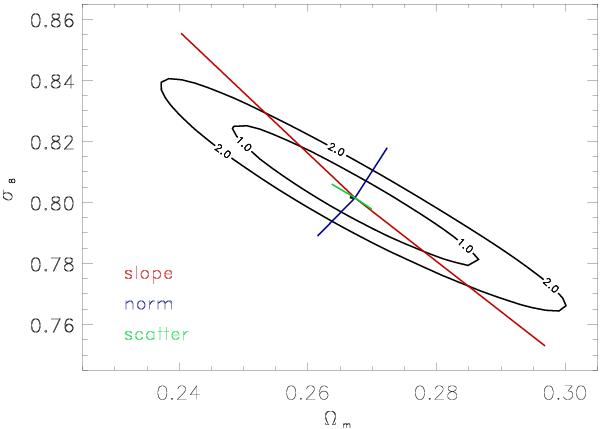
Variation in the best fitting parameters for Ωm and σ8 with a change in slope, scatter, and normalization of the LX − M scaling relation. The end- and mid-points of the bars give the results for the following values: slope =1.435, 1.51, 1.586 (±5%, largest bars), normalization =0.1292, 0.1175, 0.1058 (±10%, bars in direction of minor axis), scatter =27%, 30%, 33% (± 10%, smallest bars).
Current usage metrics show cumulative count of Article Views (full-text article views including HTML views, PDF and ePub downloads, according to the available data) and Abstracts Views on Vision4Press platform.
Data correspond to usage on the plateform after 2015. The current usage metrics is available 48-96 hours after online publication and is updated daily on week days.
Initial download of the metrics may take a while.