Fig. 4
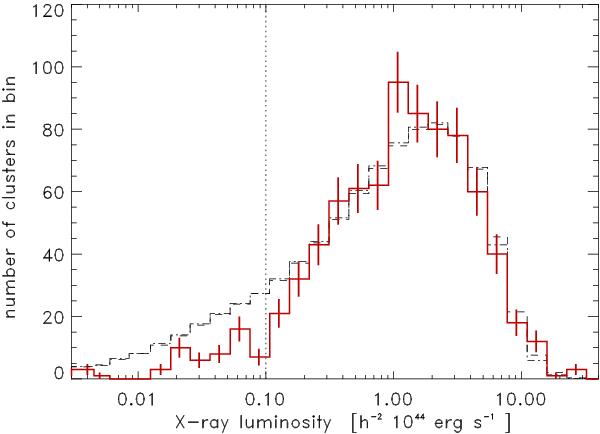
X-ray luminosity histogram of the REFLEX II clusters at z ≤ 0.3 (red line with error bars) compared to the best fitting Schechter function for the X-ray luminosity range LX ≥ 0.1 × 1044 erg s-1. The X-ray luminosity limit is indicated by the vertical dotted line. The error bars give the Poisson uncertainty of the counts in the bins.
Current usage metrics show cumulative count of Article Views (full-text article views including HTML views, PDF and ePub downloads, according to the available data) and Abstracts Views on Vision4Press platform.
Data correspond to usage on the plateform after 2015. The current usage metrics is available 48-96 hours after online publication and is updated daily on week days.
Initial download of the metrics may take a while.