Fig. B.1
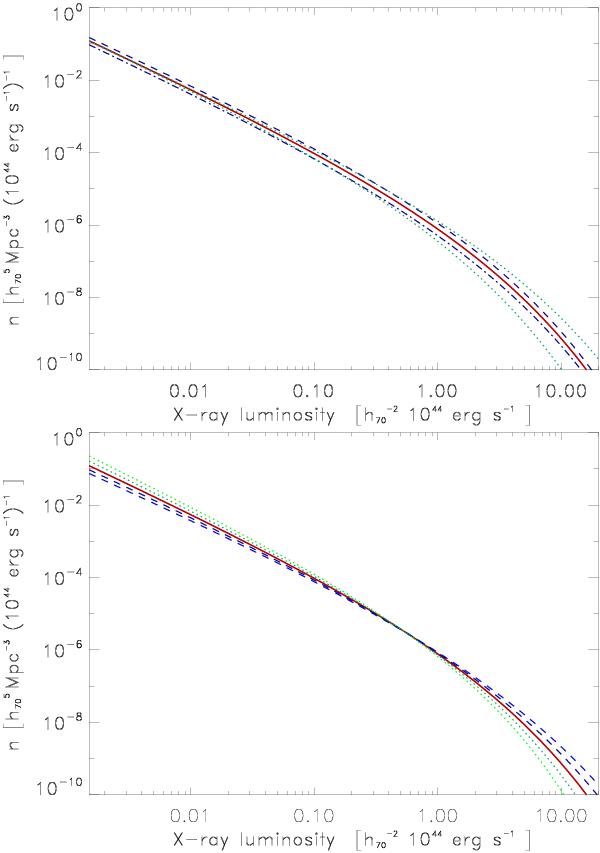
Upper panel: variations of the predicted XLF with the change in the parameters Ωm and σ8. The reference model (solid red line) has Ωm = 0.26 and σ8 = 0.8, the dashed line has Ωm = 0.30 and the dot-dashed line Ωm = 0.22, while the upper dotted line shows the result for σ8 = 0.9 and the lower one for σ8 = 0.7. Lower panel: Variations of the predicted XLF with the change in the parameter, αsl of the LX − M scaling relation. The reference model (solid red line) has αsl = 1.51, the two dashed lines correspond to αsl = 1.61 and 1.71 and the two dotted lines to αsl = 1.41 and 1.31.
Current usage metrics show cumulative count of Article Views (full-text article views including HTML views, PDF and ePub downloads, according to the available data) and Abstracts Views on Vision4Press platform.
Data correspond to usage on the plateform after 2015. The current usage metrics is available 48-96 hours after online publication and is updated daily on week days.
Initial download of the metrics may take a while.