Free Access
Fig. 13
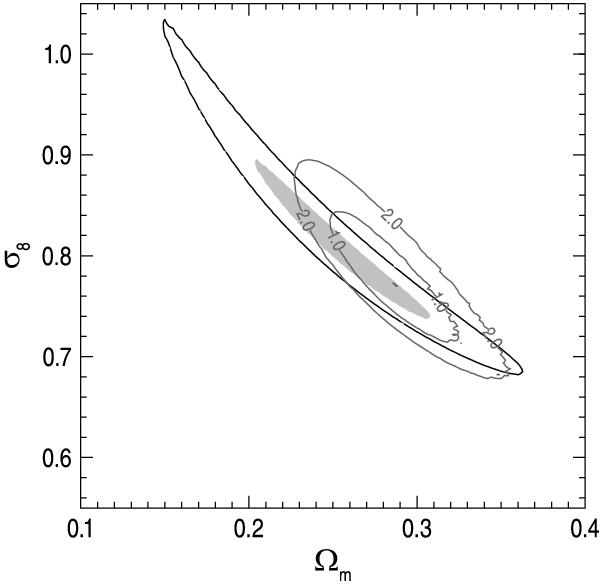
Comparison to the results from the X-ray cluster survey by Vikhlinin et al. (2009). The constraints on Ωm and σ8 shown here have been derived from the low redshift sample of 49 clusters at ⟨ z ⟩ = 0.05 of their survey. 1 and 2σ contours are shown for both surveys.
Current usage metrics show cumulative count of Article Views (full-text article views including HTML views, PDF and ePub downloads, according to the available data) and Abstracts Views on Vision4Press platform.
Data correspond to usage on the plateform after 2015. The current usage metrics is available 48-96 hours after online publication and is updated daily on week days.
Initial download of the metrics may take a while.