Fig. 5
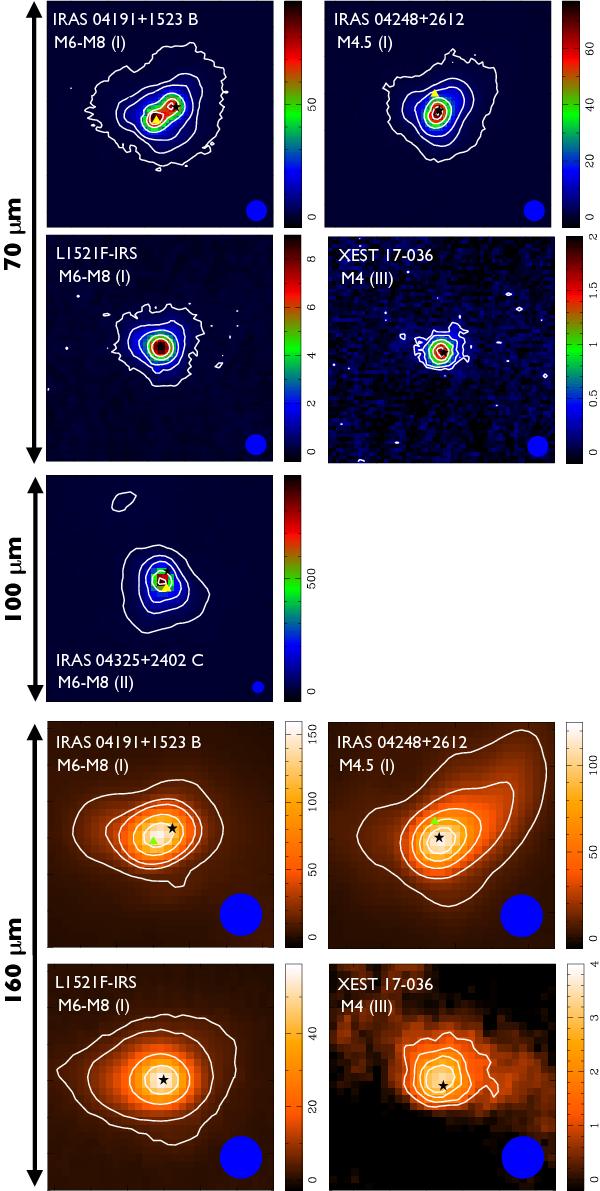
PACS blue channel (70 μm and 100 μm) and red channel (160 μm) maps of the five spatially extended TBOSS targets. Target name, spectral type and evolutionary class are labeled in the top, lefthand corner of each map. The 70 μm and 160 μm maps are 60″ in size along each axis, and the 100 μm maps are 120″ in size along each axis. Beam sizes are represented by the blue circles in the bottom, right-hand corner of each map. The scale bar shows the intensity of each map in units of mJy/pixel. 2MASS coordinates of the TBOSS targets are represented by the black stars. For binary systems, the position of the companion star are indicted with yellow triangles in the 70 μm and 100 μm maps, and by green triangles in the 160 μm maps. Contours levels begin at 3σ in all maps and extend up to 500σ, 400σ, 150σ, 40σ and 300σ in the blue channel maps of IRAS 04191+1523 B, IRAS 04248+2612, L1521F-IRS, XEST 17-036 and IRAS 04325+2402 C respectively, and up to 50σ, 60σ, 70σ and 10σ in the red channel maps of IRAS 04191+1523 B, IRAS 04248+2612, L1521F-IRS and XEST 17-036 respectively.
Current usage metrics show cumulative count of Article Views (full-text article views including HTML views, PDF and ePub downloads, according to the available data) and Abstracts Views on Vision4Press platform.
Data correspond to usage on the plateform after 2015. The current usage metrics is available 48-96 hours after online publication and is updated daily on week days.
Initial download of the metrics may take a while.