Fig. 4
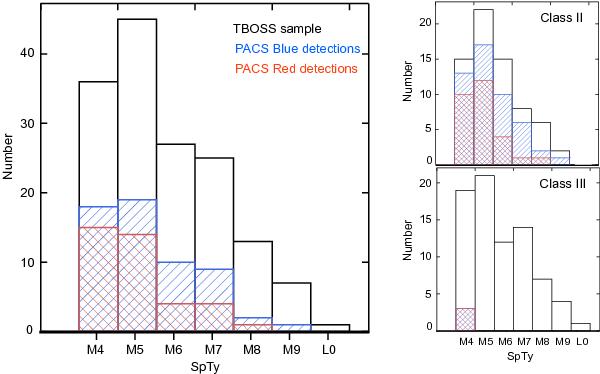
Histogram of spectral type for the TBOSS sample observed with Herschel PACS. The full observed sample and the number of PACS blue channel (70/100 μm) detections and red channel (160 μm) detections are shown on the left. The Class II and Class III observed sample, and PACS blue and red detections are shown in the top and bottom plots on the right respectively.
Current usage metrics show cumulative count of Article Views (full-text article views including HTML views, PDF and ePub downloads, according to the available data) and Abstracts Views on Vision4Press platform.
Data correspond to usage on the plateform after 2015. The current usage metrics is available 48-96 hours after online publication and is updated daily on week days.
Initial download of the metrics may take a while.