Fig. 2
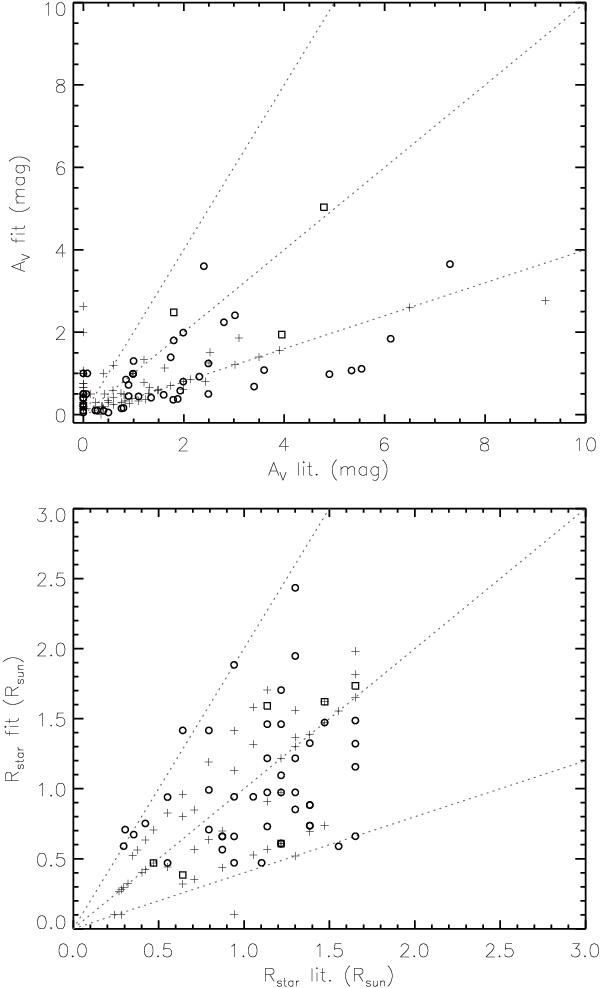
Comparison plots of the SED best-fit values of AV (top) and Rstar (bottom) against those reported in the literature. Literature AV values are compiled from the references listed in Table 4. Rstar values are derived from the spectral types reported in the literature, using the temperature conversion of Luhman et al. (2003b) and the 1 Myr evolutionary models of Baraffe et al. (1998) and Chabrier et al. (2000). Squares indicate Class I objects, circles indicate Class II objects, and crosses indicate Class III objects. The dotted lines represent fits that are 0.4, 1 and 2 times that of the literature values.
Current usage metrics show cumulative count of Article Views (full-text article views including HTML views, PDF and ePub downloads, according to the available data) and Abstracts Views on Vision4Press platform.
Data correspond to usage on the plateform after 2015. The current usage metrics is available 48-96 hours after online publication and is updated daily on week days.
Initial download of the metrics may take a while.