Fig. 17
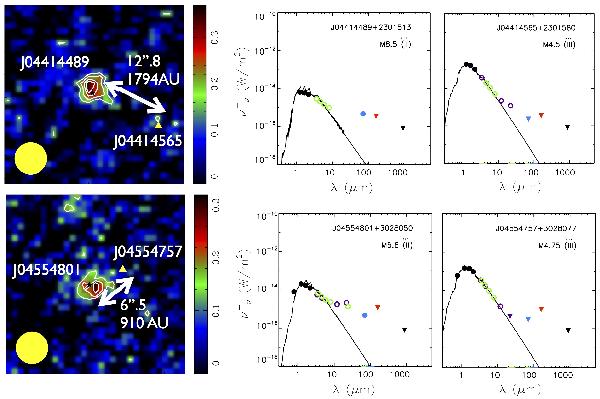
PACS blue channel (70 μm) maps (left) for the two mixed pair systems identified within the TBOSS sample; J0441489+2301513/ J04414565+2301580 and J04554801+3028050/J04554757+3028077, and the corresponding SEDs (right). The black stars in the maps show the 2MASS positions of the detected Class II secondaries (J0441489 and J04554801), and the yellow triangles mark the 2MASS positions of the undetected Class III primaries (J04414565 and J04554757). Contours are plotted at 3, 4, 5 and 6σ and the PACS 70 μm beam size is represented by the yellow circle in the bottom, left corner of each map. Target name, spectral type, and spectral class are displayed in the SEDs. Broadband photometry, compiled from optical-mm wavelengths and the underlying best-fit atmospheric models are displayed in the SEDs.
Current usage metrics show cumulative count of Article Views (full-text article views including HTML views, PDF and ePub downloads, according to the available data) and Abstracts Views on Vision4Press platform.
Data correspond to usage on the plateform after 2015. The current usage metrics is available 48-96 hours after online publication and is updated daily on week days.
Initial download of the metrics may take a while.