Fig. 1
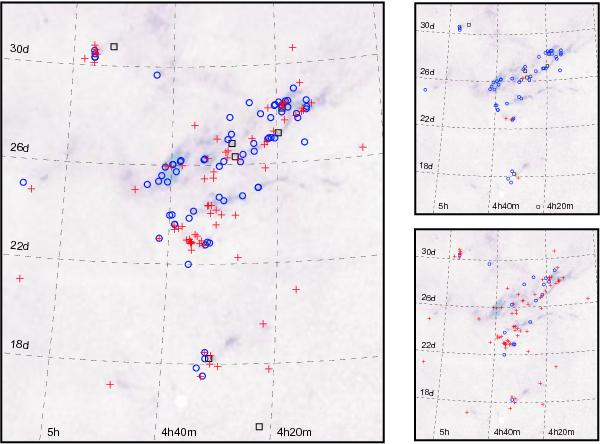
Left panel: spatial distribution of the TBOSS sample across the Taurus molecular cloud (shown in the map of extinction from Dobashi et al. 2005). Black squares indicate Class I objects, blue circles indicate Class II objects, and red crosses indicate Class III objects. Top right panel: distribution of the TBOSS sample with Herschel PACS detections. Bottom, right panel: distribution of the TBOSS sample with Herschel PACS upper limits.
Current usage metrics show cumulative count of Article Views (full-text article views including HTML views, PDF and ePub downloads, according to the available data) and Abstracts Views on Vision4Press platform.
Data correspond to usage on the plateform after 2015. The current usage metrics is available 48-96 hours after online publication and is updated daily on week days.
Initial download of the metrics may take a while.