Fig. 9
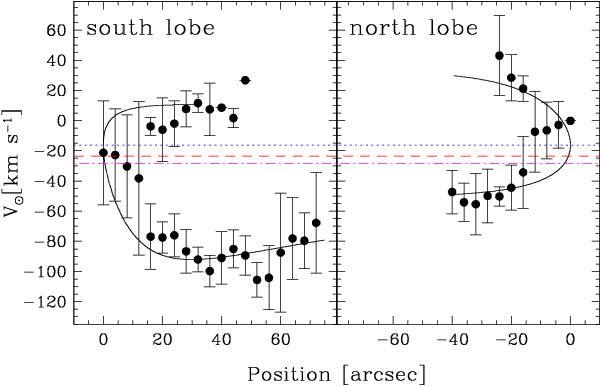
Position-velocity plot at the tips of the lobes. Position zero is defined at the point at which the slit crosses the end of each lobe. Positive and negative positions indicate distances from this reference point along the slits and toward the centre of the nebulae in the south and north lobe. Error bars indicate the [O iii] FWHM after correcting for the instrumental broadening. Solid lines show our bow-shock kinematic model (see Sect. 4.4.3). The horizontal blue dotted line indicates the heliocentric radial velocity of HR 8119 (−16.2 km s-1; Wilson 1953). The red dashed line is the Hα average velocity of Sh 2-129 obtained using Perot-Fabry measurements (−23.5 ± 5.3 km s-1, Georgelin & Georgelin 1970), while the dashed-dotted magenta line represents the CO peak located east of HR 8119 on the border of Sh 2-129 (−28.5 ± 0.7 km s-1; Blitz et al. 1982).
Current usage metrics show cumulative count of Article Views (full-text article views including HTML views, PDF and ePub downloads, according to the available data) and Abstracts Views on Vision4Press platform.
Data correspond to usage on the plateform after 2015. The current usage metrics is available 48-96 hours after online publication and is updated daily on week days.
Initial download of the metrics may take a while.