Fig. 8
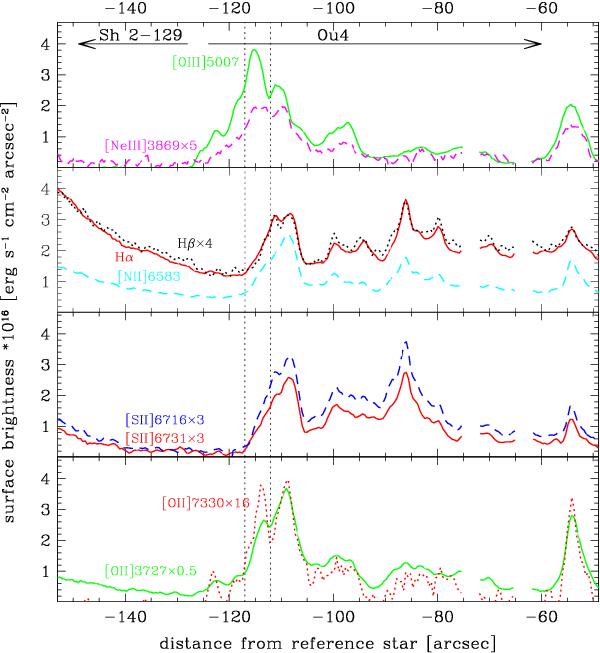
Spatial profile of selected emission lines through the tip of the southern lobe, along the slit shown in blue in Fig 6. Emission of different ions has been scaled by the factors indicated in the labels. Regions corresponding to field stars are masked. The vertical dotted line shows the integration limits for the line flux measurements presented in Table 2.
Current usage metrics show cumulative count of Article Views (full-text article views including HTML views, PDF and ePub downloads, according to the available data) and Abstracts Views on Vision4Press platform.
Data correspond to usage on the plateform after 2015. The current usage metrics is available 48-96 hours after online publication and is updated daily on week days.
Initial download of the metrics may take a while.