Fig. 14
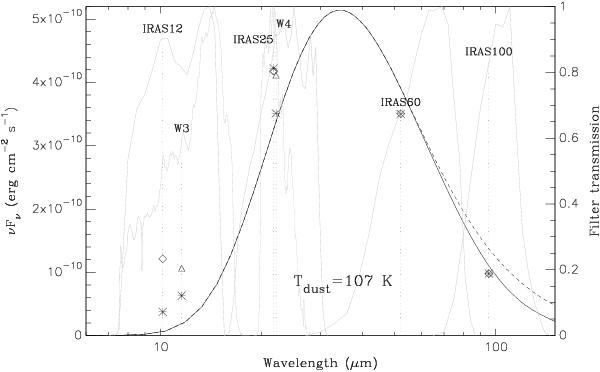
Spectral energy distribution of the infrared emission in the central part of Ou4. Diamonds and triangles are IRIS and WISE data points, obtained from aperture photometry (Fig. 13). Grey lines show the transmission profiles of the IRAS and WISE broad-band filters, with vertical dotted lines indicating the effective wavelength. The solid line is the dust emission (single-temperature modified black-body model) fitted to the IRIS data points (diamonds), and asterisks are the corresponding modelled fluxes in each filter. The dashed line is the corresponding black-body model.
Current usage metrics show cumulative count of Article Views (full-text article views including HTML views, PDF and ePub downloads, according to the available data) and Abstracts Views on Vision4Press platform.
Data correspond to usage on the plateform after 2015. The current usage metrics is available 48-96 hours after online publication and is updated daily on week days.
Initial download of the metrics may take a while.