Fig. 13
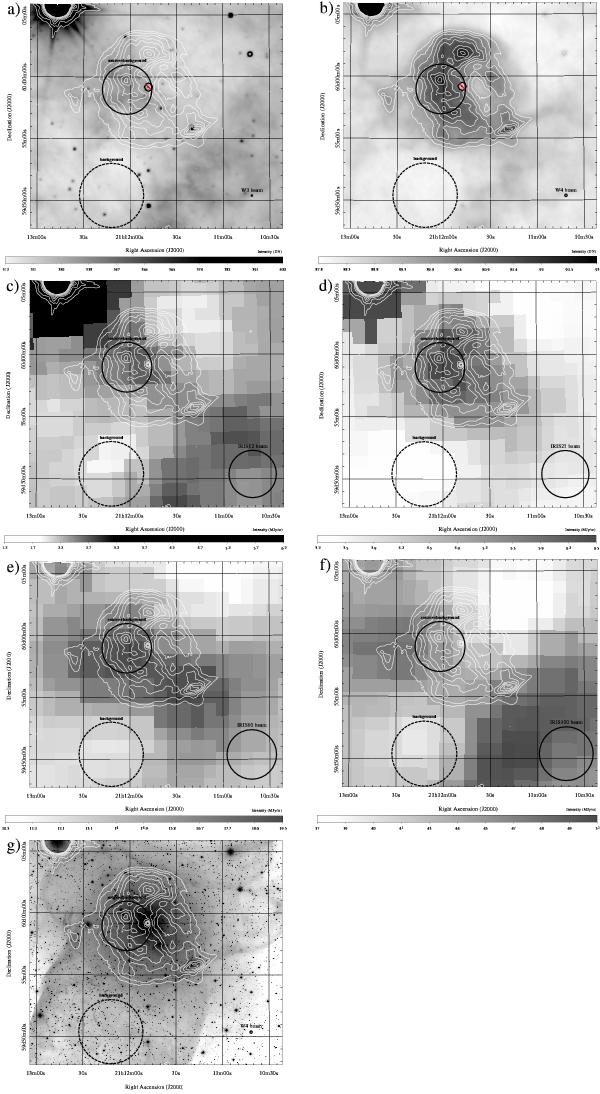
Mid- to far-infrared views of the central part of Ou4. a) WISE 12 μm (W3-filter) image. b) WISE 22 μm (W4-filter) image. c) IRIS 12 μm image. d) IRIS 25 sμm image. e) IRIS 60 μm image. f) IRIS 100 μm image. g) INT [O iii] image for comparison purpose. The contour map is the 22 μm emission from 89.375 to 92.5 digital numbers (DN) with linear step of 0.446 DN (i.e., from 2.471 to 2.557 mJy/arcsec2 with linear step of 0.012 mJy/arcsec2). The FWHM resolution is plot in the bottom-right corner of each panel. The two large circles are the regions used for the aperture photometry (see text and Fig. 14).
Current usage metrics show cumulative count of Article Views (full-text article views including HTML views, PDF and ePub downloads, according to the available data) and Abstracts Views on Vision4Press platform.
Data correspond to usage on the plateform after 2015. The current usage metrics is available 48-96 hours after online publication and is updated daily on week days.
Initial download of the metrics may take a while.