Fig. 1
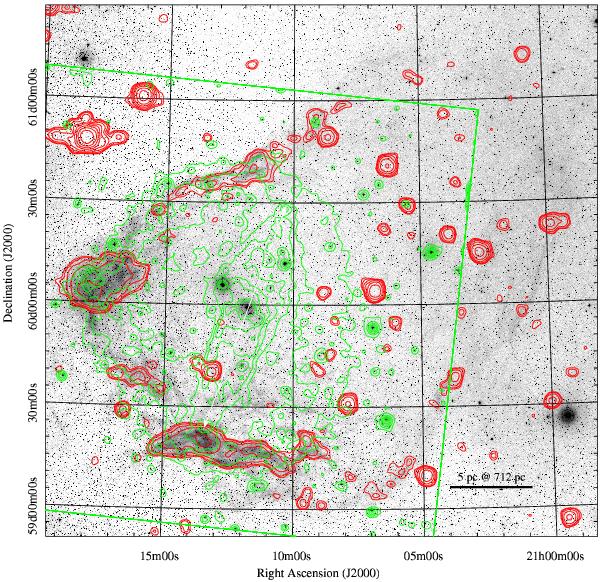
Blister H ii region Sh2-129 and Ou4. The DSS2 R-band image is shown in greyscale in the background. The red contour map is the Green Bank 6 cm survey (Condon et al. 1994) using 10 contours from 0.01 to 2.8 Jy/beam with a linear step. The green contour map is a smoothed and thresholded [O iii] image. The image and contour-map scales are logarithmic. The white arrowed line has a length of  and indicates the position of the giant outflow Ou4. HR 8119, the young massive star that ionises Sh 2-129, is close to the middle of this line.
Current usage metrics show cumulative count of Article Views (full-text article views including HTML views, PDF and ePub downloads, according to the available data) and Abstracts Views on Vision4Press platform.
Data correspond to usage on the plateform after 2015. The current usage metrics is available 48-96 hours after online publication and is updated daily on week days.
Initial download of the metrics may take a while.