Fig. 8
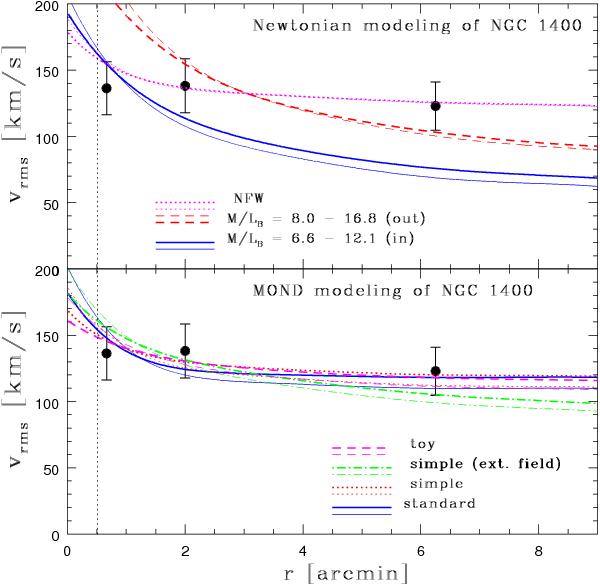
Jeans Newtonian and MOND modeling of the projected velocity dispersion of NGC 1400. The thick lines are for isotropic cases and the thin lines are for fits based on βlit. Upper panel: for the Newtonian approach, there are two regions where the fitting was performed: inner region (interior to ~ 3 − 4Re) and outer region (beyond ~ 3Re). The thick solid blue line is for M/LB = 6.6 (inner region) and the thick dashed red line is for M/LB = 12.1 (outer region). The thin solid blue line is for M/LB = 8.0 (inner region) and the thin red dashed line M/LB = 16.8 (outer region). The NFW models with M∗/LB = 5.5(6.5), rs = 400 arcsec, and ρs = 0.0025(0.0035) M⊙ pc-3 are plotted with the thick (thin) dotted magenta line. Lower panel: isotropic MOND models of the projected velocity dispersion of NGC 1400 for three interpolation functions μ(r). The standard MOND model is presented with the thick (thin) solid blue lines for M/LB = 5.8(7.6); the simple MOND model is presented with the thick (thin) dotted red lines for M/LB = 4.8(6.3), and the toy MOND model is presented with the thick (thin) dashed red lines for M/LB = 3.7(5.0). The green dot-dashed lines are for the simple MOND model with the external field (see text for details). In both panels, one effective radius is indicated by a vertical dotted line.
Current usage metrics show cumulative count of Article Views (full-text article views including HTML views, PDF and ePub downloads, according to the available data) and Abstracts Views on Vision4Press platform.
Data correspond to usage on the plateform after 2015. The current usage metrics is available 48-96 hours after online publication and is updated daily on week days.
Initial download of the metrics may take a while.