Fig. 24
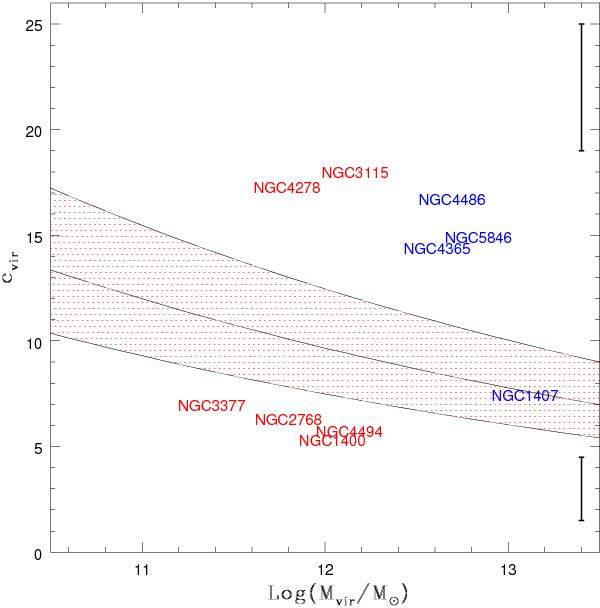
Concentration parameter as a function of the virial mass (expressed in the solar units). The central line of the hatched region is given by Eq. (18), and its limits are determined with 1σ scatter (see text for details). The vertical solid lines on the right hand side of the plot represent the typical error bars for the concentration parameter for two classes of galaxies: the lower line is for the objects below the hatched region, and the higher line is for the objects above the hatched region. The names of the slow (fast) rotators are plotted in blue (red).
Current usage metrics show cumulative count of Article Views (full-text article views including HTML views, PDF and ePub downloads, according to the available data) and Abstracts Views on Vision4Press platform.
Data correspond to usage on the plateform after 2015. The current usage metrics is available 48-96 hours after online publication and is updated daily on week days.
Initial download of the metrics may take a while.