Fig. 21
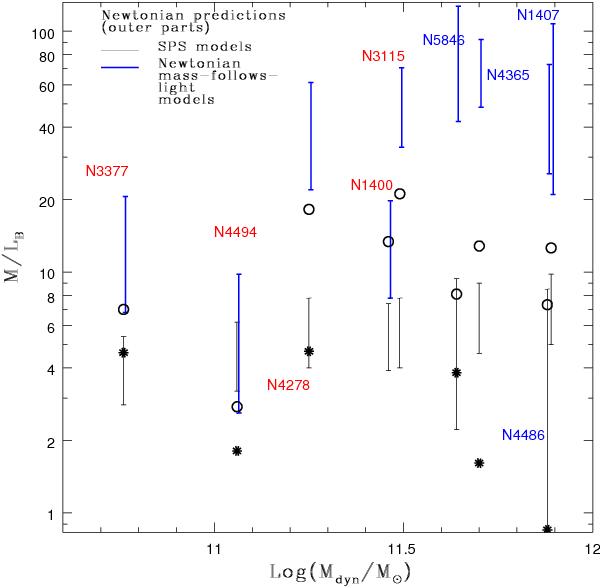
Comparison of the Newtonian mass-follows-light models (thick solid lines, shifted for the sake of visibility) with the predictions of various SPS models (thin solid lines). In this plot, the comparison is made for the outer parts (exterior to ~ 3Re, except for NGC 4365 and NGC 4486, for which the exterior parts are beyond 1Re and 0.35Re, respectively) of the galaxies in the sample. The meaning of symbols is the same as in Fig. 20.
Current usage metrics show cumulative count of Article Views (full-text article views including HTML views, PDF and ePub downloads, according to the available data) and Abstracts Views on Vision4Press platform.
Data correspond to usage on the plateform after 2015. The current usage metrics is available 48-96 hours after online publication and is updated daily on week days.
Initial download of the metrics may take a while.