Fig. 18
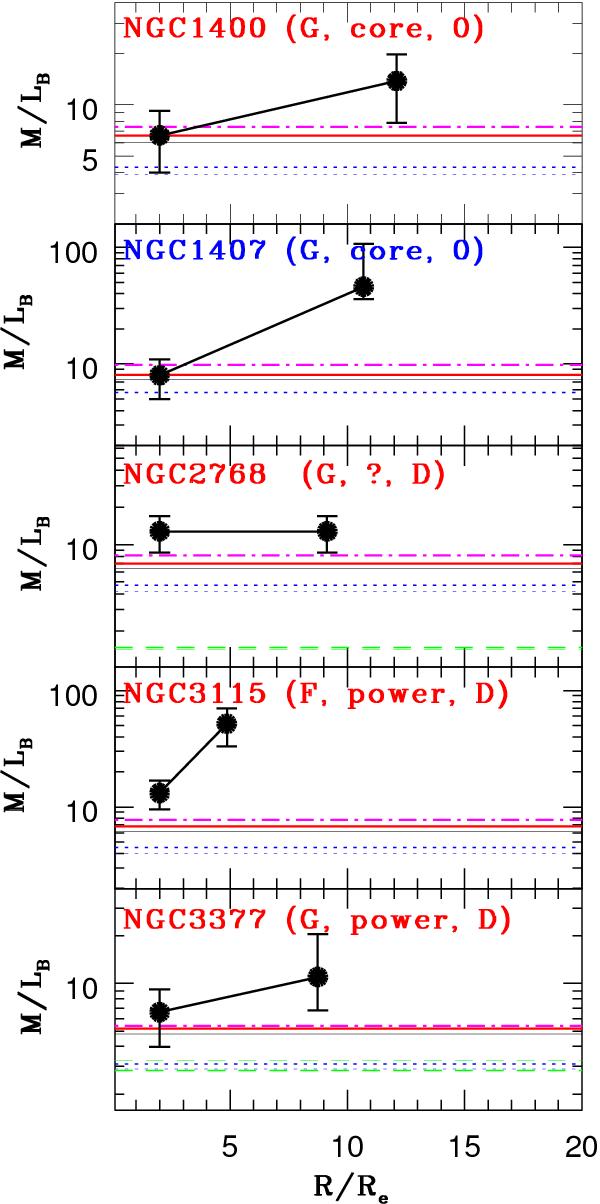
Mass-to-light profiles of the galaxies in the sample based on the Newtonian models. For each object, two observational points are plotted: the inner one at 2Re and the outer one at the outermost bin. For each galaxy, we indicate: the environment (“G” means that the galaxy belongs to a group, “F” is a field galaxy, and “C” means that the galaxy belongs to a cluster), profile type (“core” is for core, “∩” in Table 4, “power” is for power low, “\” in Table 4, and “?” is unknown) and mean isotope shape (“D” indicates disky isophotes, “B” indicates boxy isophotes, and “0” indicates pure ellipses). The meaning of the horizontal lines is as follows: thin solid black lines are for the BC models; thick red solid lines are for the PEGASE models; dotted blue lines are for the exponential SFH IP13 models with the Kroupa IMF; thick dotted blue lines are for the IP13 disc galaxy model based on the Kroupa IMF; thick dot-dashed line is for the IP13 disk galaxy model based on the Salpeter IMF; thin green dashed lines are for the CvD12 models allowing for IMF variation; and thick green dashed lines are for the CvD12 models assuming a fixed MW (Kroupa) IMF. The names of the slow (fast) rotators are plotted using Roman characters (italic).
Current usage metrics show cumulative count of Article Views (full-text article views including HTML views, PDF and ePub downloads, according to the available data) and Abstracts Views on Vision4Press platform.
Data correspond to usage on the plateform after 2015. The current usage metrics is available 48-96 hours after online publication and is updated daily on week days.
Initial download of the metrics may take a while.