Fig. 5
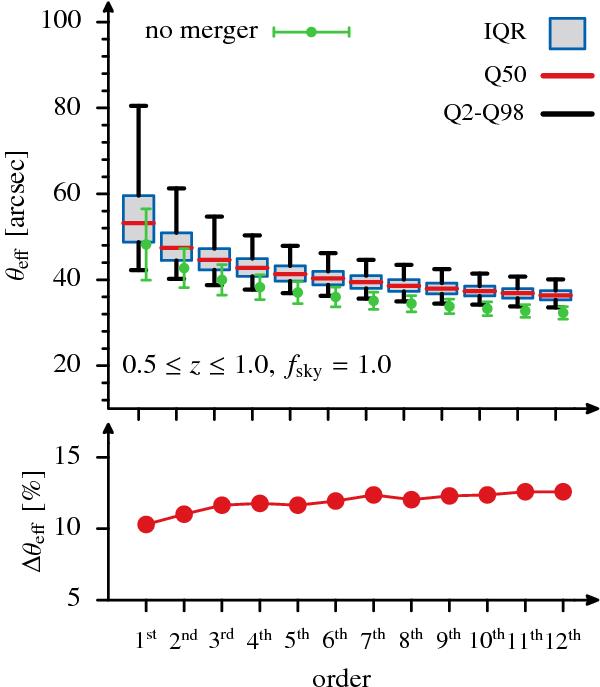
Box-and-whisker diagram comparing the order statistics of the twelve largest Einstein radii including and excluding cluster mergers. For each order, in the upper plot the red lines indicate the median (Q50), the blue bordered grey boxes give the interquartile range (IQR), and the black whiskers mark the range between the 2 and 98 percentile (Q2, Q98) of the order statistics including the impact of cluster mergers. The green errors bars indicate the 68% confidence intervals of the order statistics excluding mergers. The lower plot shows the percentage increase of the medians caused by mergers.
Current usage metrics show cumulative count of Article Views (full-text article views including HTML views, PDF and ePub downloads, according to the available data) and Abstracts Views on Vision4Press platform.
Data correspond to usage on the plateform after 2015. The current usage metrics is available 48-96 hours after online publication and is updated daily on week days.
Initial download of the metrics may take a while.