Fig. 2
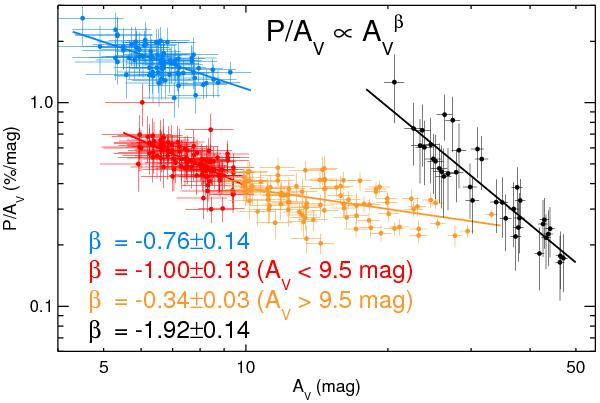
Polarization efficiency (P/AV) as a function of the visual extinction AV for the three wavelengths. The blue dots are the optical data, red dots are near-IR for AV< 9.5 mag, orange dots are near-IR data for AV> 9.5 mag and black dots are the submm data. The lines show the linear fit in the log-log basis for the aforementioned four different data.
Current usage metrics show cumulative count of Article Views (full-text article views including HTML views, PDF and ePub downloads, according to the available data) and Abstracts Views on Vision4Press platform.
Data correspond to usage on the plateform after 2015. The current usage metrics is available 48-96 hours after online publication and is updated daily on week days.
Initial download of the metrics may take a while.