Fig. 1
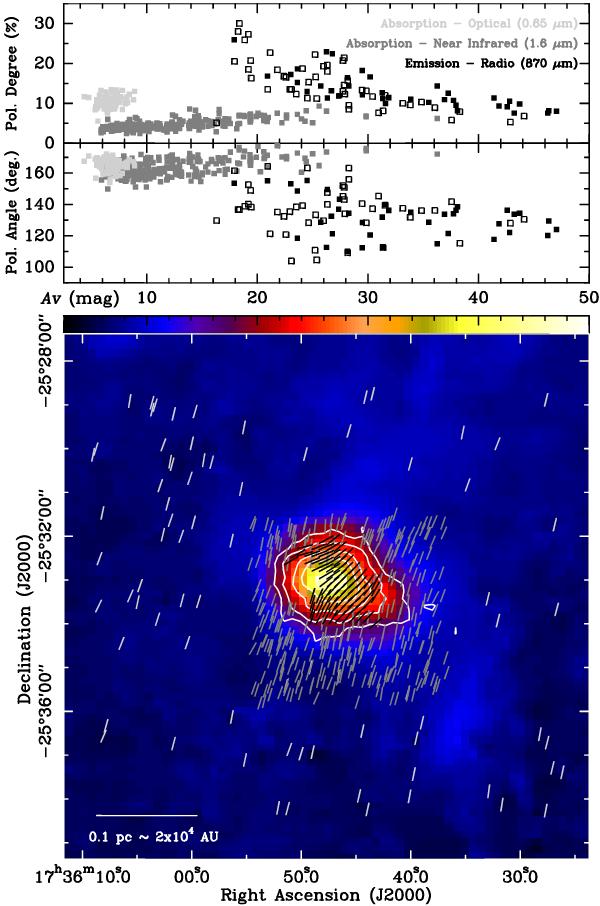
Multi-wavelength polarimetry toward Pipe-109: in the lower panel, optical (light grey), near-IR (grey), and submm (black) polarization vectors are plotted over the visual extinction map of Román-Zúñiga et al. (2010). The vectors are scaled to the same size. The white contours are the 870 μm dust continuum emission detected by PolKa. The contours are 10, 20, 30, 40, and 50 times the rms of the map (~5 mJy beam-1). The submm vectors are rotated by 90° to show the magnetic field direction. The dependence of the polarization degree and polarization angle of the three wavelengths with respect to the visual extinction is shown at the upper panels. Light grey and grey squares refer to the optical and near-IR data, respectively. Filled black squares and open squares refer to the submm data at P/σP> 3 and 2, respectively.
Current usage metrics show cumulative count of Article Views (full-text article views including HTML views, PDF and ePub downloads, according to the available data) and Abstracts Views on Vision4Press platform.
Data correspond to usage on the plateform after 2015. The current usage metrics is available 48-96 hours after online publication and is updated daily on week days.
Initial download of the metrics may take a while.