Fig. 3
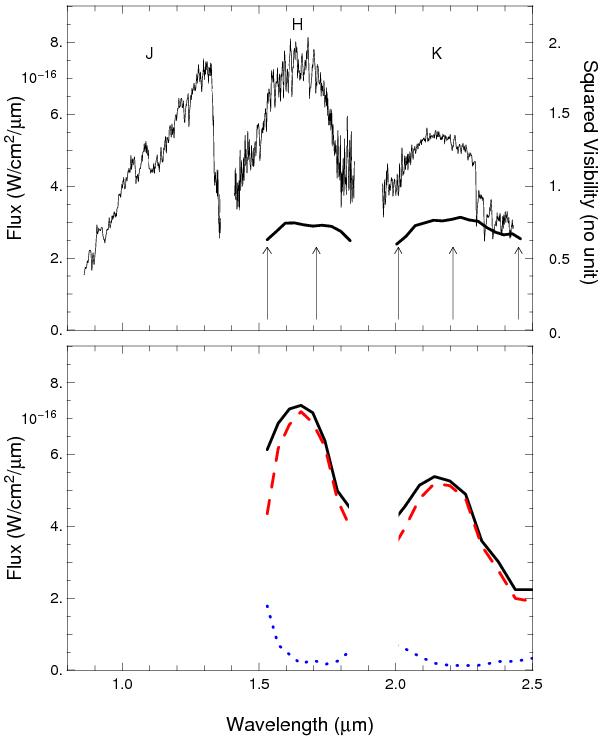
Top: 0.85–2.5 micron spectrum of V838 Mon on 11 December 2013 corrected for extinction using E(B − V) = 0.5. For comparison, we show the AMBER longest baseline visibility (thick black lines, right axis), and indicate with arrows the wavelengths of Fig. 2. Bottom: spectra extracted from the AMBER data according to a downgraded resolution version of the above spectrum (black line). Red dashed line: the star spectrum. Blue dotted line: extended emission spectrum.
Current usage metrics show cumulative count of Article Views (full-text article views including HTML views, PDF and ePub downloads, according to the available data) and Abstracts Views on Vision4Press platform.
Data correspond to usage on the plateform after 2015. The current usage metrics is available 48-96 hours after online publication and is updated daily on week days.
Initial download of the metrics may take a while.